Introduction To Splunk
Installing Splunk on Ubuntu
1
2
3
4
5
6
cd ~/Downloads/
wget -O splunk-9.4.0-6b4ebe426ca6-linux-amd64.tgz "https://download.splunk.com/products/splunk/releases/9.4.0/linux/splunk-9.4.0-6b4ebe426ca6-linux-amd64.tgz"
sudo tar xvzf splunk-9.4.0-6b4ebe426ca6-linux-amd64.tgz -C /opt
cd /opt/splunk/bin/
sudo ./splunk start --accept-license
sudo ./splunk enable boot-start # Run at boot
Splunk then asked to create a user. I gave the same username as the ubuntu VM.
Note: production environment it would be more secure to use unique usernames and passwords for every system.
After creating the user, I was prompted to visit http://127.0.0.1:8000, the loopback address on port 8000, to visit the Splunk admin page on the browser. If I were to visit Splunk from the Windows Lab machine, or another machine on this virtual network, I would need to go to http://<Ubuntu_IP>:8000 to see the page.
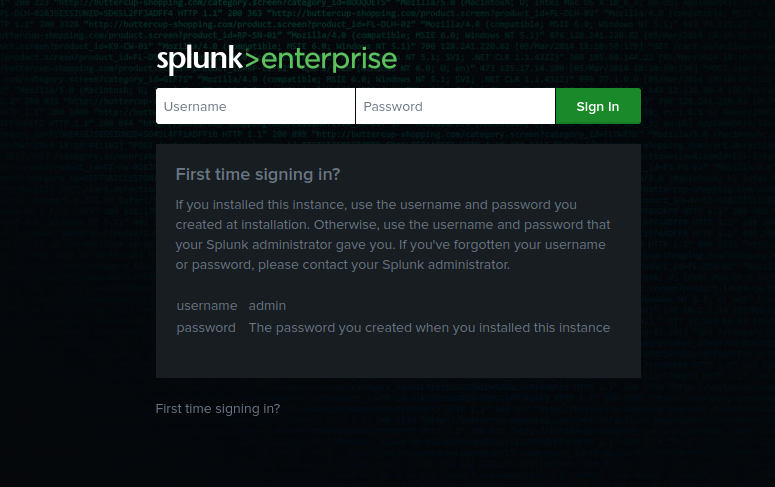
Once the page loaded I was asked to log in so I gave it the Jarnathan credentials.
Importing Log Data to Splunk
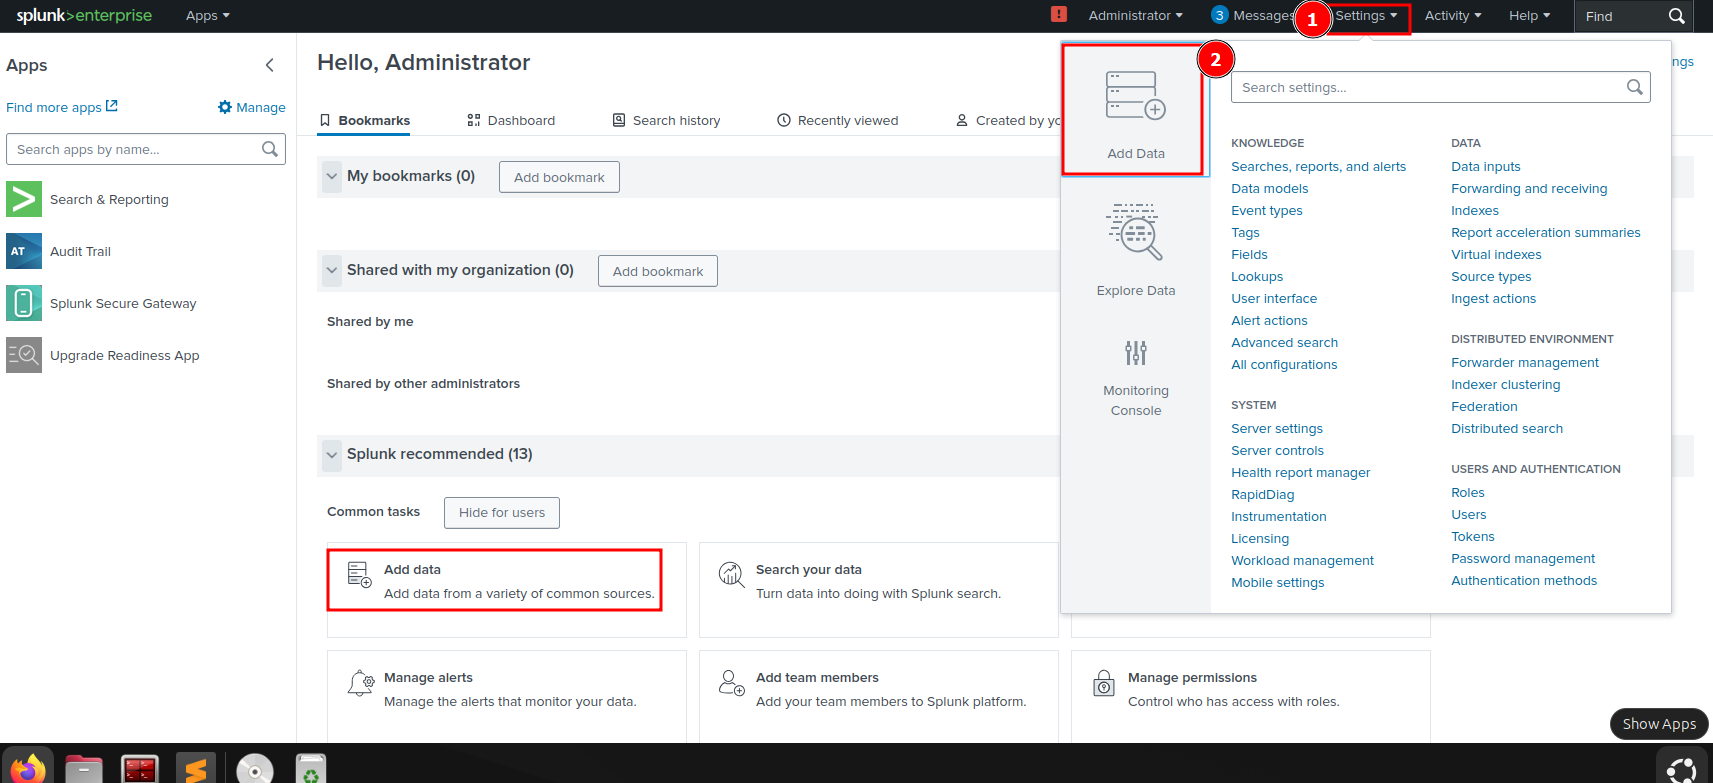
Data files can be added to Splunk by either clicking the Add data button on the Home Dashboard or by clicking Settings > Add Data in the top right corner of the screen.
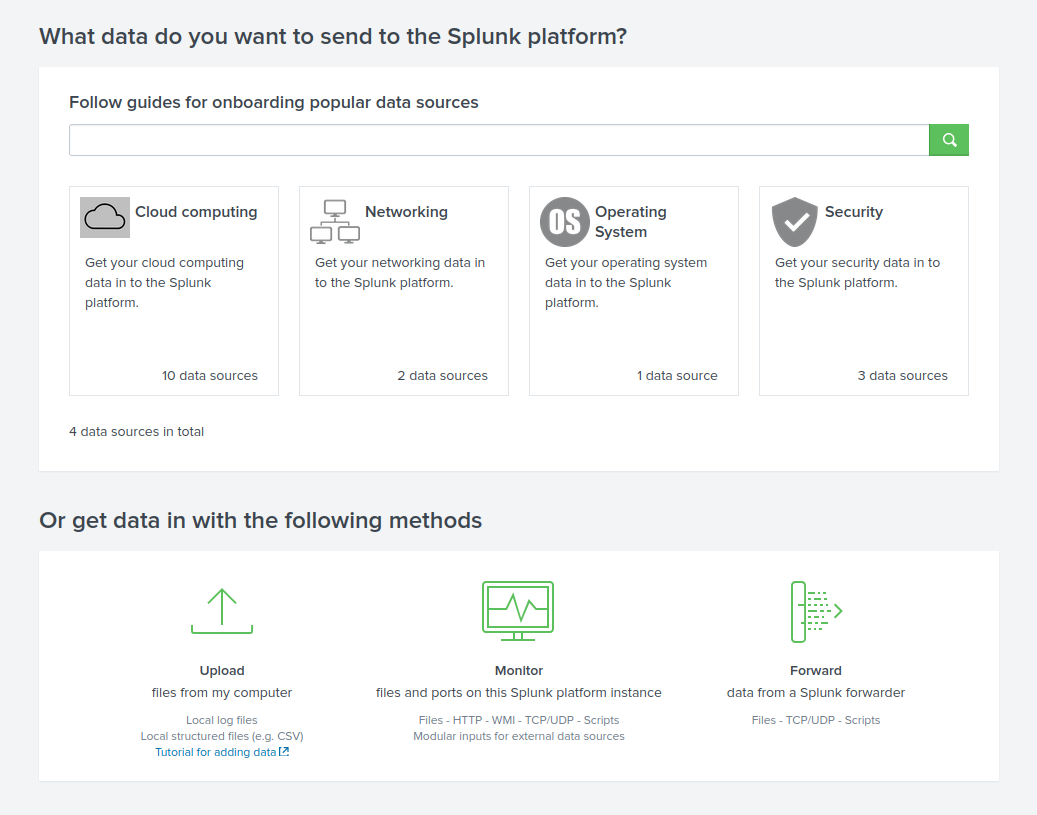
Splunk has a few ways to import data:
- Uploading files to the Splunk Platform
- Monitoring the data coming from the Splunk platform instance
Forwarding log data from other sources
- Endpoints
- Network Devices
- Cloud Devices
Uploading a Log File
I was given the sample log data as a csv file called sample.csv so I used the Upload button in the Add Data page.
Download the example file here: sample.csv
It just has the following text data:
1
2
3
4
5
6
7
8
9
10
11
12
13
timestamp,username,event_type,source_ip,authentication_status
2024-07-20 12:00:00,jdoe,login,192.168.1.101,success
2024-07-20 12:05:00,asmith,login,192.168.1.102,success
2024-07-20 12:10:00,jdoe,login,192.168.1.101,failed
2024-07-20 12:15:00,mjohnson,login,192.168.1.103,failed
2024-07-20 12:20:00,asmith,login,192.168.1.102,success
2024-07-20 12:25:00,mjohnson,login,192.168.1.103,success
2024-07-20 12:30:00,rrodriguez,login,192.168.1.104,success
2024-07-20 12:35:00,bwilliams,login,192.168.1.105,failed
2024-07-20 12:40:00,rrodriguez,login,192.168.1.104,success
2024-07-20 12:45:00,jdoe,login,192.168.1.101,success
2024-07-20 12:50:00,bwilliams,login,192.168.1.105,success
2024-07-20 12:55:00,jdoe,login,192.168.1.101,failed
Add Data wizard walked me through the following steps:
- Select Source
- I selected the
sample.csvfile
- I selected the
- Set Source Type
- Here I ensured Splunk recognized the
.csvfile type - I also previewed the data to make sure Splunk was reading and formatting it correctly
- Here I ensured Splunk recognized the
- Input Settings
- Host field value: Should be set to name of machine that collected the log
- Since my file is fictitious I kept the host name as is
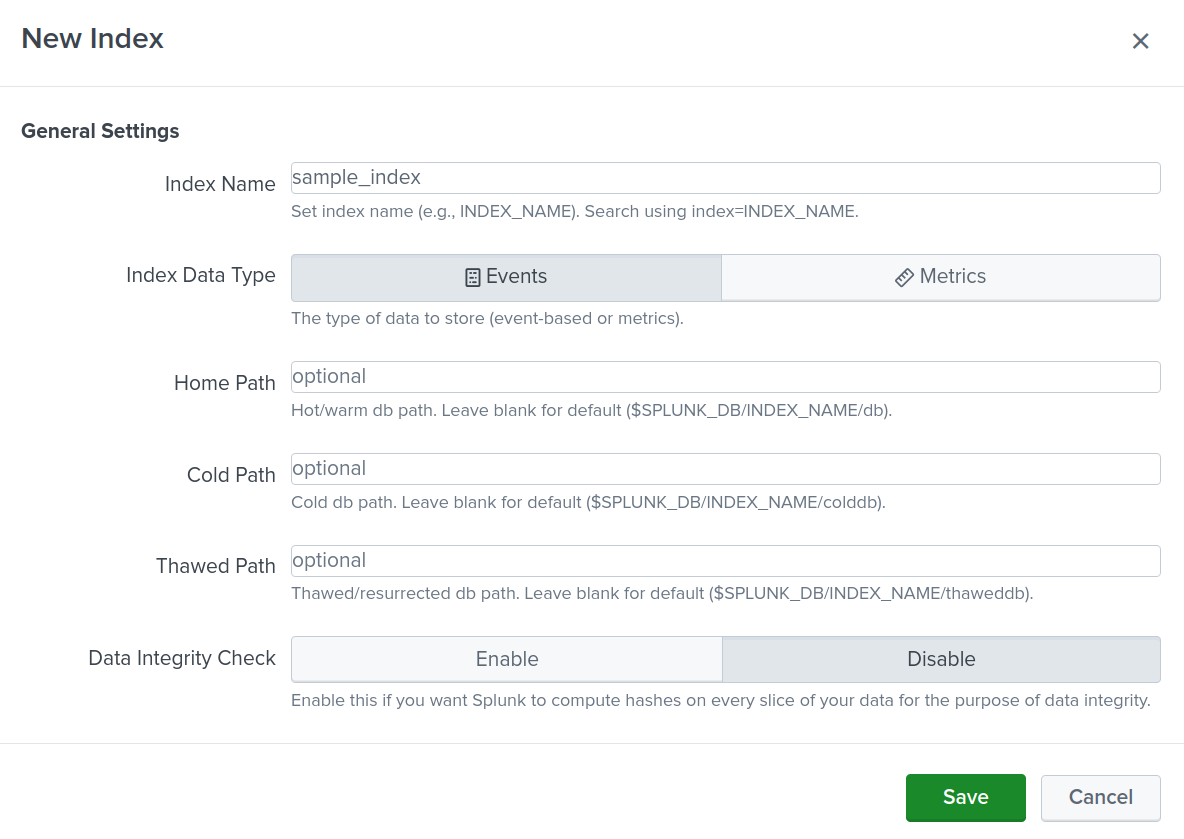
- Index
- Here I created a new index
- Review
- Done
Searching By Index
At Splunk > Apps > Search (<Splunk IP>:8000/en-US/app/search/search)
1
index="sample_index"
Search Functions
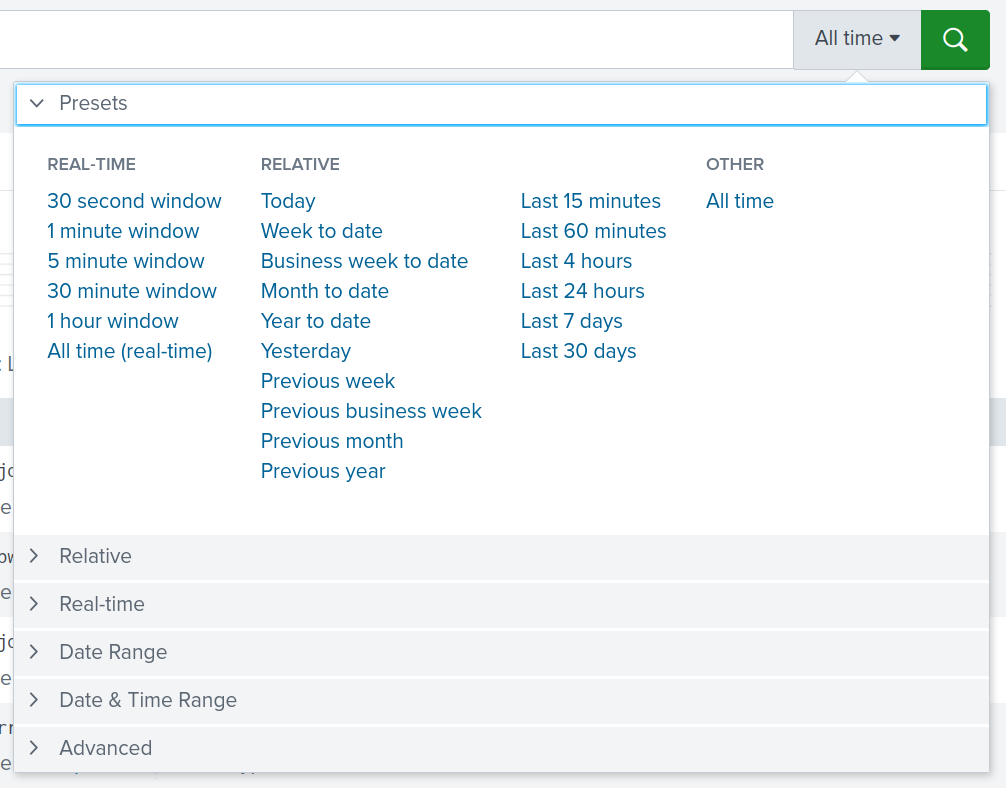
Time Frame
This feature filters the search results to only include a specific range of time.
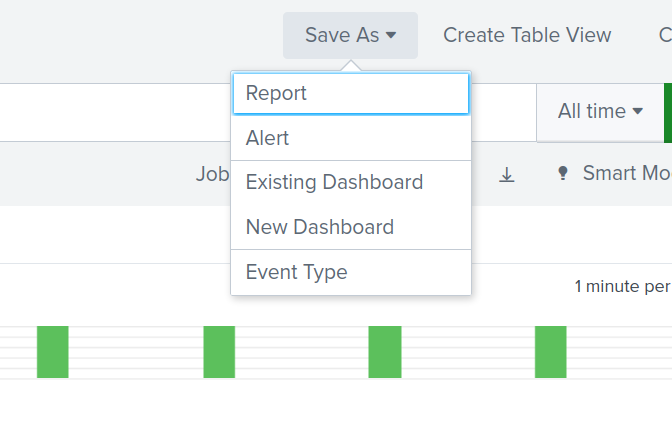
Save As
The Save As button in the top right corner has different options that can be used to export the current search
- Report
- Alert
- Existing Dashboard
- New Dashboard
Results Tabs
These tabs reveal information about the data collected by the search criteria. There are four main tabs.
- Events - List of all events
- Patterns - Detected from underlying data. Needs >5000 events to be useful
- Statistics
- Visualization
A lot of the automatically generated information will only be generated and useful if you have enough data to support the analysis functions.
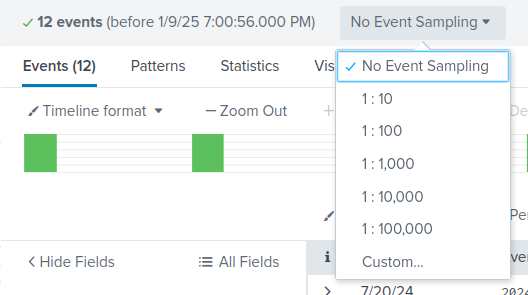
Event Sampling
Selecting an option from the Event Sampling drop down allows us to display only one result per X amount of events.
- 1:10
- 1:100
- 1:1000
- 1:10000
- 1:100000
- Custom
Job Settings
Splunk searches are treated as “Jobs”.
- Create unique URL for the job to share results with others
- Export to CSV, JSON, XML
Modes
Splunk Search has three modes:
- Fast Mode - Field discovery off
- Smart Mode - Field discovery on
- Verbose Mode - All data
Event Timeline
Visual representation of the data over time
Searching Events
By clicking on a text string in the event data allows us to refine the search based on the selected text.
- Add to search
- Exclude from search
- New search
Clicking the icon next to each option will open in a new tab
By excluding bwilliams from the search results I ended up with 2 fewer results.
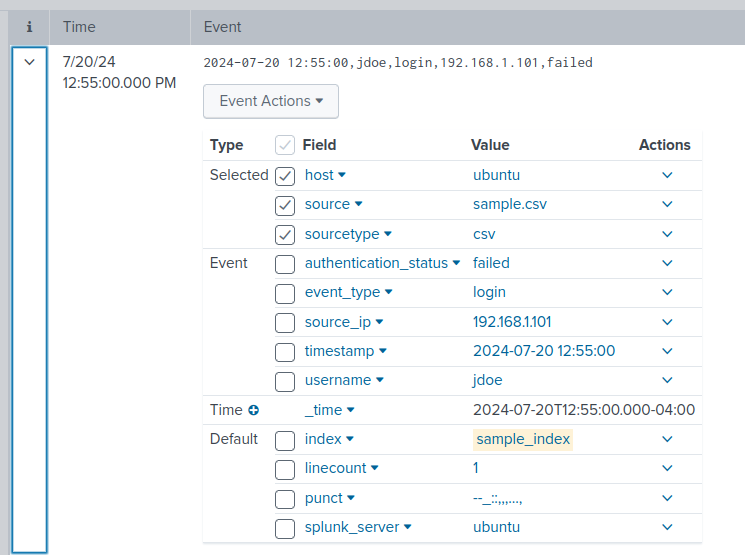
Event Item Fields
By clicking on the drop down arrow next to an event shows the available fields.
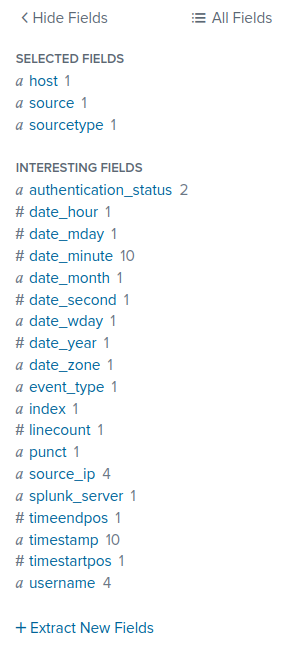
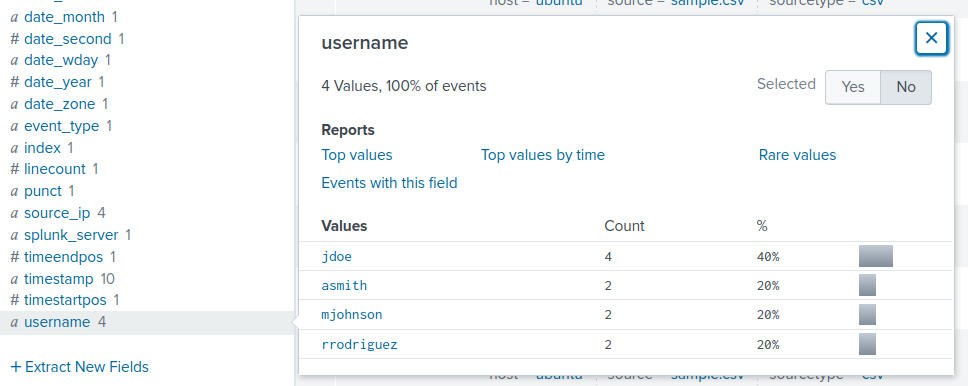
There is also a field overview on the left side bar
Clicking on a field in this bar gives us statistics of this field’s results.
